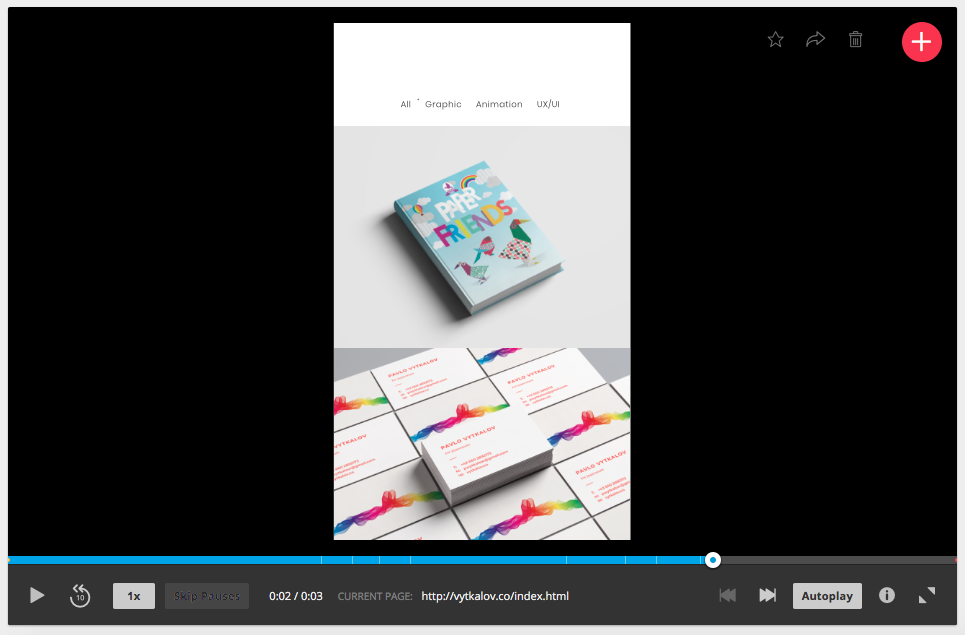
After gathering information and researching topic, the next step was to get to the actual using of software. For now my main interest was creating the first heatmap. Since there’s no such feature in Google Analytics I chose another tool. I set up tracking by adding simple lines of code to my personal website.
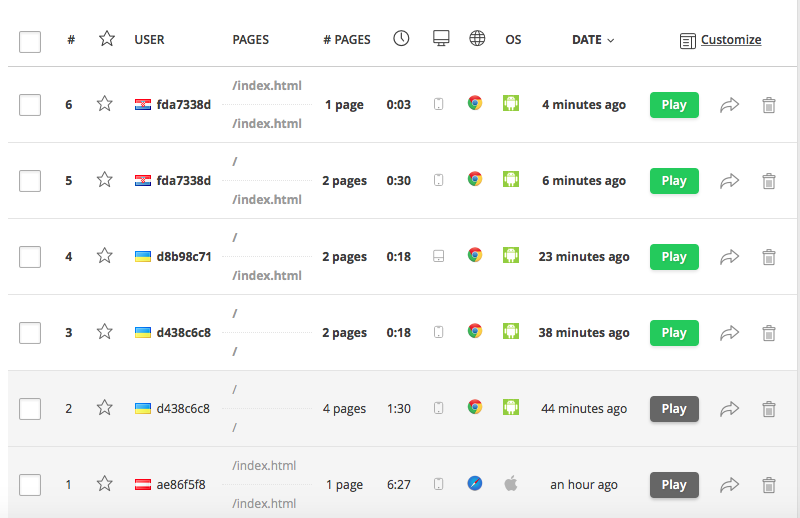
- Hotjar provides users with a number of information about users such as country of origin, OS, time on website, resolution of the display etc.
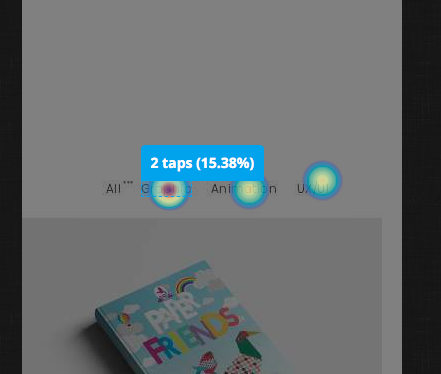
2. The most interesting feature is heat maps. It’s possible to select scroll or tap maps, data from desktop computers, phones to tablets. Map gives clear visualisation that most of users sorted out types of the work.
3. It’s possible to view a session of the single user as well