I followed a TensorFlow tutorial that puts the paradigms mentioned some blogs prior (Q-Learning, epsilon-greedy policies) to practice. I implemented an AI that learns to play the ‚mountain car game‘, which is about getting a small car onto the peak of a mountain. This is done by swinging left and right, gaining momentum and using that to win. To increase the difficulty a bit, there is a time constraint of three seconds.
This blog is about the setup and the inital results.
The code for this project was basically provided by the afore-mentioned tutorial. Some minor adjustments were needed, though: some libraries needed to be installed (Open AI gym & MatPlotLib), some variables were protected and could not be accessed directly and an implementation of the most important constants was missing. These constants include:
- Min epsilon: the smallest learning rate possible
- Max epsilon: the starting learning rate
- Lambda: the basic learning rate decay
- Gamma: an advanced learning rate decay
- Batch size: indicates how much of the network will be trained at once
The first four parameters determine how fast the network learns. Too fast means that the network rushes through its options; not realizing what it’s actually doing. Too slow means that the network knows what it’s doing, but it takes long until an actual difference happens. In the best case, the network starts of fast but should become slower after several attempts – therefore, a so-called learning rate decay is implemented to decrease the learning rate step by step.
When I started the program, it looked like this:
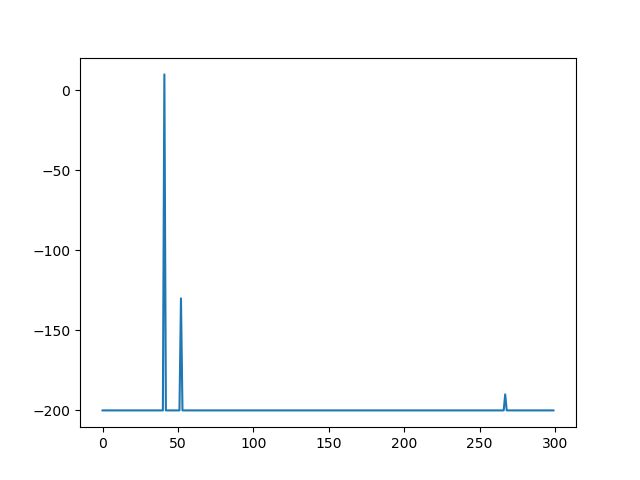
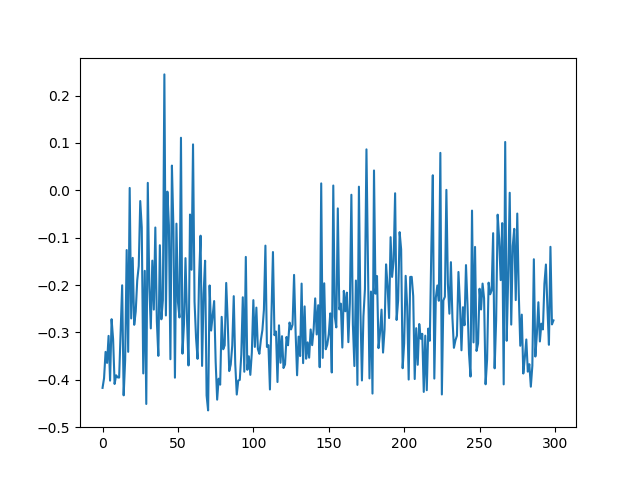
The AI can do three things – move left, do not move and move right. The actions will not influence the score, but the position of the car does. If the car is too far away from the goal, the score will be affected negatively. The worst score possible is -200. Of course, the goal of the AI is to get this number as high as possible. After 20 minutes, these were the results:
The left figure shows the scores over 300 attempts. Obviously, this outcome is very poor; the AI performed consistently bad – only one play was somewhat decent. The right figure shows the actual nearness to the goal (the x-coordinate) after each of the 300 attempts. It shows no signs of improvements over time – no signs of actual learning.
After changing some of the constants, I tried it one more time:
This time, the learning rate started off higher and would not decay as fast as in the first run.
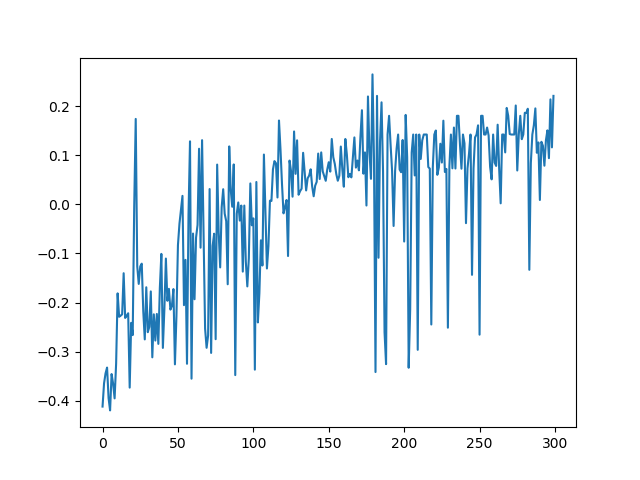
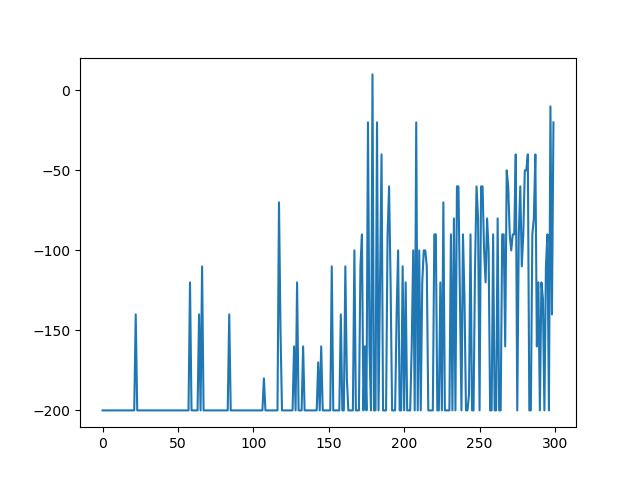
After 20 minutes, the results looked way more promising:
Again, the figure to the left shows the scores over all attempts while the right shows the nearness to the goal over all attempts. In comparison to the first run, the results are a lot better. The AI discovered success in swinging left to gain momentum – and did so consistently, optimizing its actions with every following attempt. The AI showed signs of learning – however, there is still room for improvement.


