Google analytics is a tool that helps to track the behavior of the user. It helps to understand how users interact with the website, which buttons and how often he clicks. How user moves through a website and what he likes what ignores. The goal behind Analytics to better understand the user, his preferences, pattern of behavior and overall create the better user experience.
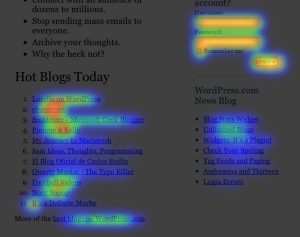
One of the most effective features is heat maps. It visualizes user behavior and how he navigates through the website. That’s crucial to understand if a design fulfills the goal. For example, the designer places some information on the right side of the website. But a heat map shows users ignore the section, therefore, the design doesn’t convey the message. It could happen another way. Users do some intense mouse clicking on the empty area expecting a button/menu which is not there. Google Analytics also shows how users jump from one menu to another one. For example if designers developed a specific user story but users don’t follow it for some reason. It’s important to trust intuition and your skills but I believe it should be backed up with some quantitative research. Google Analytics could be that tool.
