Virtuelle Produktentwicklung

Aufgrund der rasant gestiegenen Rechenleistung ist es heutzutage auch für kleinere Unternehmen immer wichtiger ihre Produkte mittels Simulation auf Herz und Nieren zu testen. Die Ergebnisse sind bei weitem aussagekräftiger als noch vor einigen Jahren. Eine präzise Detailgenauigkeit der Ergebnisse ist heutzutage nicht mehr wegzudenken. Die Simulation wird heute bereits in frühen Entwicklungsphasen eingesetzt, wobei sie früher nur dazu diente, auf experimentellen Weg gewonnene Daten abzusichern oder eingetretene Problemfälle zu untersuchen. Simulation ist ein wesentlicher Bestandteil der Entwicklung und macht oftmals den Versuch überflüssig.

Besonders in der Fahrzeug Industrie wird der Vorteil von virtueller Produktentwicklung deutlich. Früher wurden dutzende Autos an die Wand gefahren, um das Verhalten von Karosserie oder Rückhaltesystemen zu beurteilen. Dann kamen realistische Simulationen dazu die das reale Verhalten von Bauteilen virtuell nachmodellierten. Mittlerweile sind diese Berechnungen so genau, dass Automobilhersteller weitgehend auf physische Crashtests verzichten. Das beschleunigt den Entwicklungsprozess und erspart enormen Aufwand und Kosten. Kleine Änderungen an der Karosserie, die man früher mühsam nachbauen musste, erfordern heute in der virtuellen Produktentwicklung nur wenige Mausklicks und ein paar Stunden Rechenzeit, um die Variation des Crashverhaltens zu berechnen.

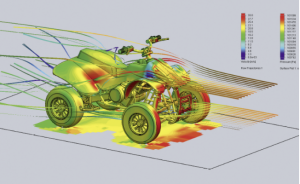
Vollständig eingebettet in die 3D-CAD-Software ermöglichen CFD-Tools den Anwendern, Flüssigkeits- und Gasströmungen unter realen Bedingungen zu simulieren.

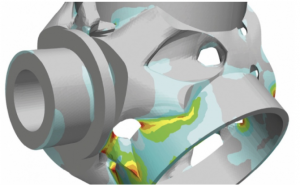
Eine Methode zur softwaregestützten Gewichtsreduzierung eines Bauteils ist die simulationsbasierte Strukturoptimierung mit einer Optimierungssoftware.


Quelle: https://www.digital-engineering-magazin.de/fachartikel/virtuelle-produktentwicklung-simulation-der-fruehen-entwicklungsphase
Reinforcement Learning – Another Perspective, QnA

The AI learns. When playing Mario, at first, the AI tries to do nothing. It will see that doing nothing is not how the game is supposed to be played – and therefore it will try to move. Eventually, it will run into a wall and see that simply moving is not enough. After several attempts it will jump over the wall; most likely by accident. It will soon learn that jumping is very important to reach the goal – and thus it will jump more often. At some point, it will jump into an enemy. Step by step the AI will make more and more progress until it eventually reaches the goal.

However, one important question rises here: How is this useful for us? I want to use this blog to look at my topic from a less technical standpoint. I want to answer this kind of rising questions that might be unclear – thus, this blog follows a Q&A approach.

Webdesign: Potential, Herausforderungen und Restriktionen

Zwischen den in meinen letzten Beiträgen gezeigtem klassischen Storytelling Ansatz von Video und Print und ständig geforderter Interaktivität wie es in Games der Fall ist, steht das World Wide Web. Websites sind bei weitem dynamischer als Print, Film und Co., aber bieten im Vergleich zu Games ganz andere Herausforderungen in der Gestaltung der Interaktivität. Über Responsiveness bis hin zu Gewohnheiten der User, Ladezeiten und Richtlinien hinsichtlich Accessibility tun sich in diesem Bereich Limitationen auf, welche es bei der Umsetzung einer gelungenen, geschichtstragenden Website zu beachten gibt.

A friendly Alien.

A friendly Alien.
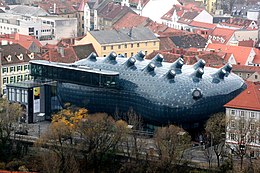
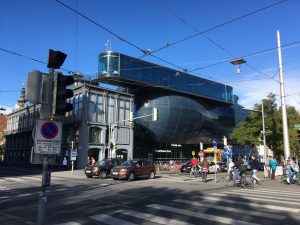
Ein Kunsthaus für Graz.


Das Kunsthaus Graz wurde 2003 im Rahmen des Kulturhauptstadtjahres errichtet und gilt seither als neues architektonisches Wahrzeichen der Graz.

Das Kunsthaus dient als Institution für die Ausrichtung internationaler Ausstellung multidisziplinärer, moderner und zeitgenössischer Kunst, welche von den 1960er Jahren bis hin zur Gegenwart entwickelt wurden. Das Kunsthaus ist kein Museum, das sammelt, sowie es keine Dauerausstellungen einrichtet. Es verfügt ebenso über keine Dauerdepots und Forschungseinrichtungen. Es dient ausschließlich der Präsentation und Vermittlung zeitgenössischer künstlerischen Produktion.

Das Kunsthaus Graz gehört gemeinsam mit 12 weiteren Museen zum Universalmuseum Joanneum.

Über die BIX-Medienfassade
BIX = BIG PIXEL

Die BIX ist eine Licht- und Medienfassade am Kunsthaus Graz in Richtung Mur und Innenstadt. Seit der Eröffnung im Jahr 2003 dient sie Künstlerinnen und Künstlern sowie Kuratorinnen und Kuratoren zur Kommunikation und Interaktion mit dem Stadtraum. Durch ihre wechselnde Bespielung unterstreicht die BIX den organisch geformten Baukörper.


„Die Pixel schimmern in der Figur wie Pailletten auf der Umhüllung.“
„Das Kunsthaus kann seine Haut wechseln wie ein Chamäleon.“
„Die BIX ist Teil der ,Skinʻ:
Das Kunsthaus Graz hat keine Wände, kein Dach und keinen Sockel,
sondern eine zusammenhängende Hülle, eine Haut.“
Technische Daten

– 946 handelsübliche 40-Watt-Leuchtstoffröhren zu je 40 cm Durchmesser auf 900 m2 Fläche, mit ca. 45 m Breite und ca. 20 m Höhe, sind hinter den Acrylglasplatten einzeln mit einer Software ansteuerbar, dimmbar und können 20 Mal pro Sekunde aufblitzen.

– Animationen, Bilder und Schriftzüge mit einer Auflösung von 56 x 25 Pixel können über die Fassade laufen.

– Der BIX-Stromverbrauch kostet im Monat ca. 42 Euro.

– Die meisten bisher umgesetzten Projekte wurden über ein BIX-File verwirklicht.

– Ein BIX-File ist eine Datei im .mov-Format.

– Für die Erstellung eines generativen Projekts für die BIX werden Grundkenntnisse in den Programmiersprachen Code Java und/oder Processing IDE benötigt.

– Projekte können über den BIX-Simulator getestet werden.

– Die gesamte BIX-Software (bestehend aus BIX-Editor, BIX-Director und BIX-Simulator) wurde von John Dekron geschrieben.


realities:united

Die BIX-Fassade wurde von realities:united errichtet, einem berliner Studio für Kunst und Kultur.

„Für uns bedeutete diese Arbeit eine Art Grundlagenforschung.
Jetzt musste allerdings das Kunsthaus Sprachforschung betreiben, denn es fehlten Erfahrung, Semantik und Grammatik, um mit solchen Oberflächen sinnvoll umzugehen. In unseren Augen waren zu beauftragende Künstlerinnen und Künstler potenziell sehr gut geeignet, eine solche Grundlagenforschung systematisch und gut zu betreiben.“

Fitts’s Law in Design

Fitts’ Law demonstrates how to ease interactions through the careful sizing and positioning of interface elements. It states: The time it takes to acquire a target is a function of the distance to and size of the target. It is particularly important when designing buttons and other clickable on-screen elements.

1. Size
When an entire button is large, clickable, and has clear boundaries, they’re easy to select. Users can intuitively understand where to click and where not to click. But forcing users to point their cursor directly over a specific part of a button, like the text, requires more precision and time. But bigger isn’t always better. Buttons that are large enough to demand attention without disrupting the visual balance of your page are what maximize usability.

2. Distance
When users land on the website, and you want them to take a specific action, you need to estimate where the starting point of their cursor will be. This is called the prime pixel. It allows building a consistent and easy-to-navigate site and creates the shortest path to the desired CTA. For instance, Google’s search box is always in the center of the screen because when users enter the site, they’re most likely looking at the middle of the screen. Most of the time, the prime pixel should influence the location of the target object. And the shorter the path to the desired action, the better the user experience.

3.Effort
A lot of vital commands like ‚exit‘, ’start‘, and ’shut down‘ are located in the corners of your computer screen. Placing buttons there makes it easier for users to select them because the buttons are pinned by two sides. And the cursor stops at each side, so you can’t go beyond them. This means you don’t have to be as precise when you want to click a button in a corner or edge. You just have to move your cursor to its general vicinity.

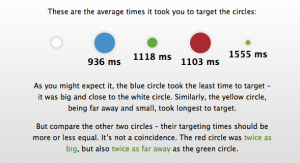
It’s always important to test assumptions. I found an online software where it’s easy to check it. http://fww.few.vu.nl/hci/interactive/fitts/

  1. Al circles are of the same size and in equal distance to target.
  2. Circles are still the same but the most distant takes the longest to target.
  3. Circles are different sizes but in equal distance. It proves that biggest objects are easier to aim.

  1. Fitt’s law. https://blog.hubspot.com/marketing/fitts-law
  2. Test programe http://fww.few.vu.nl/hci/interactive/fitts/
  3. The importance of size and distance in UI design https://www.interaction-design.org/literature/article/fitts-s-law-the-importance-of-size-and-distance-in-ui-design

Key Metrics in Google Analytics

Google Analytics is a complicated tool with a lot of options. But what are the most useful reports and metrics that a designer should pay attention to? If an objective to redesign a website then critical indicators of poor performance include bounce rate, conversion rate, exit rate, a lower engagement that signify visitors have problems interacting with the content of the website.

Bounce rate is a metric that measures the percentage of people who land on the website and do completely nothing on the page they entered. So they don’t click on a menu item, a ‘read more’ link or any other internal links on the page. This means that the Google Analytics server doesn’t receive a trigger from the visitor.

Conversion rate is the indicator of the proportion of visitors who end up making a purchase or completing another action that is beneficial to the owner of the website. It brings in revenue and often a website’s primary indicator of success.

How fast a website load is critical for most visitors. If load speeds are too slow, visitors may quit waiting and leave. Improving load speed is one of the best ways to improve engagement.

Engagement indicators show how much visitors interact with the website. These include the duration of time they spend and the number of actions they complete (downloading files, watching videos, filling out forms, etc).

1. How to Use Google Analytics to Improve Your Web Design Projects https://www.shopify.com/partners/blog/google-analytics-to-improve-web-design-projects

2. Understanding bounce rate in Google Analytics
https://yoast.com/understanding-bounce-rate-google-analytics/

3. Critical Metrics to Watch With Google Analytics https://www.a2hosting.com/blog/8-critical-metrics-watch-google-analytics/

an accident – I can’t believe it…

Yesterday something really really bad happened to me (again).

I was sitting in class, listening to the lecture of Sebjanic. And then the „DIY“ part started. Actually pretty to nice to have hands on classes. But moving through the pretty stuffed class can be pretty annoying and sometimes risky. We were cutting, clueing, screwing and then. Then it happened. I was rolling back with my chair to carry some tools for our self-made microscope. And then it went right through me. I heard an uncanny noise from behind. You wont guess what it was. No it had nothing to do with the cutter, the ruler, the screwer, the hot glue. It was „just“ my charger for the Mac Book. Which hang down loosely – cracked at the plug. The sockets in this class (307a) are exactly on the same height like the seatbacks. So I just destroyed it with a little, strong movement. And of course it happened right after I plugged it in – so my mac was pretty uncharged. Just a little side fact.